GHRexplore
![]()

Overview
GHRexplore is an R package for exploratory analysis of temporal and spatio-temporal health data including case counts, incidence rates, and covariates. It provides commonly used visualizations and supports standard data transformations such as temporal and spatial aggregations. The package also offers extensive customization options for the resulting figures. Currently available plotting functions include:

plot_timeseries: Plots time series of covariates, case counts or incidence rates.plot_timeseries2: Plots time series of two covariates, case counts or incidence rates using a dual-axis plot.plot_heatmap: Plots a time series of covariates, case counts or incidence rates as heatmaps.plot_seasonality: Plots yearly time series to detect seasonal patterns of covariates, case counts or incidence rates.plot_correlation: Plots a correlation matrix of a series of variables.plot_map: Plots a choropleth map of covariates, case counts or incidence rates.plot_bivariate: Plots a bivariate plot of two numerical and/or categorical variables.plot_multiple,plot_combineandplot_compare: Used to generate graphs of several variables at the same time.epiyw_to_dateanddate_to_epiyw: Functions to convert between dates and epidemiological year-weeks for any day of the week.
GHRexplore is one of the packages developed by the Global Health Resilience (GHR) team at the Barcelona Supercomputing Center (BSC) within the IDExtremes project.
GHRexplore is the starting point for building INLA models for inference and forecasting of health impacts. It is complemented by the GHRmodel package, which is used to define, fit, and assess the models, and by GHRpredict, which focuses on generating out-of-sample predictions, conducting cross-validation analyses, and evaluating predictive performance. More information about the toolkit and an online version of the package documentation can be found at the GHR tools website.
Installation
# Install from CRAN
install.packages("GHRexplore")

# Get the development version from Gitlab
devtools::install_git('https://earth.bsc.es/gitlab/ghr/ghrexplore.git')
Usage
library("GHRexplore")

# Use data included in the package to plot a heatmap with spatial aggregation
data("dengue_MS")
plot_heatmap(data = dengue_MS,
             var = "dengue_cases",
             type = "inc",
             pop = "population",
             time = "date",
             area = "micro_code",
             aggregate_space = "meso_code",
             transform = "log10p1",
title = "Dengue incidence in Brazil") 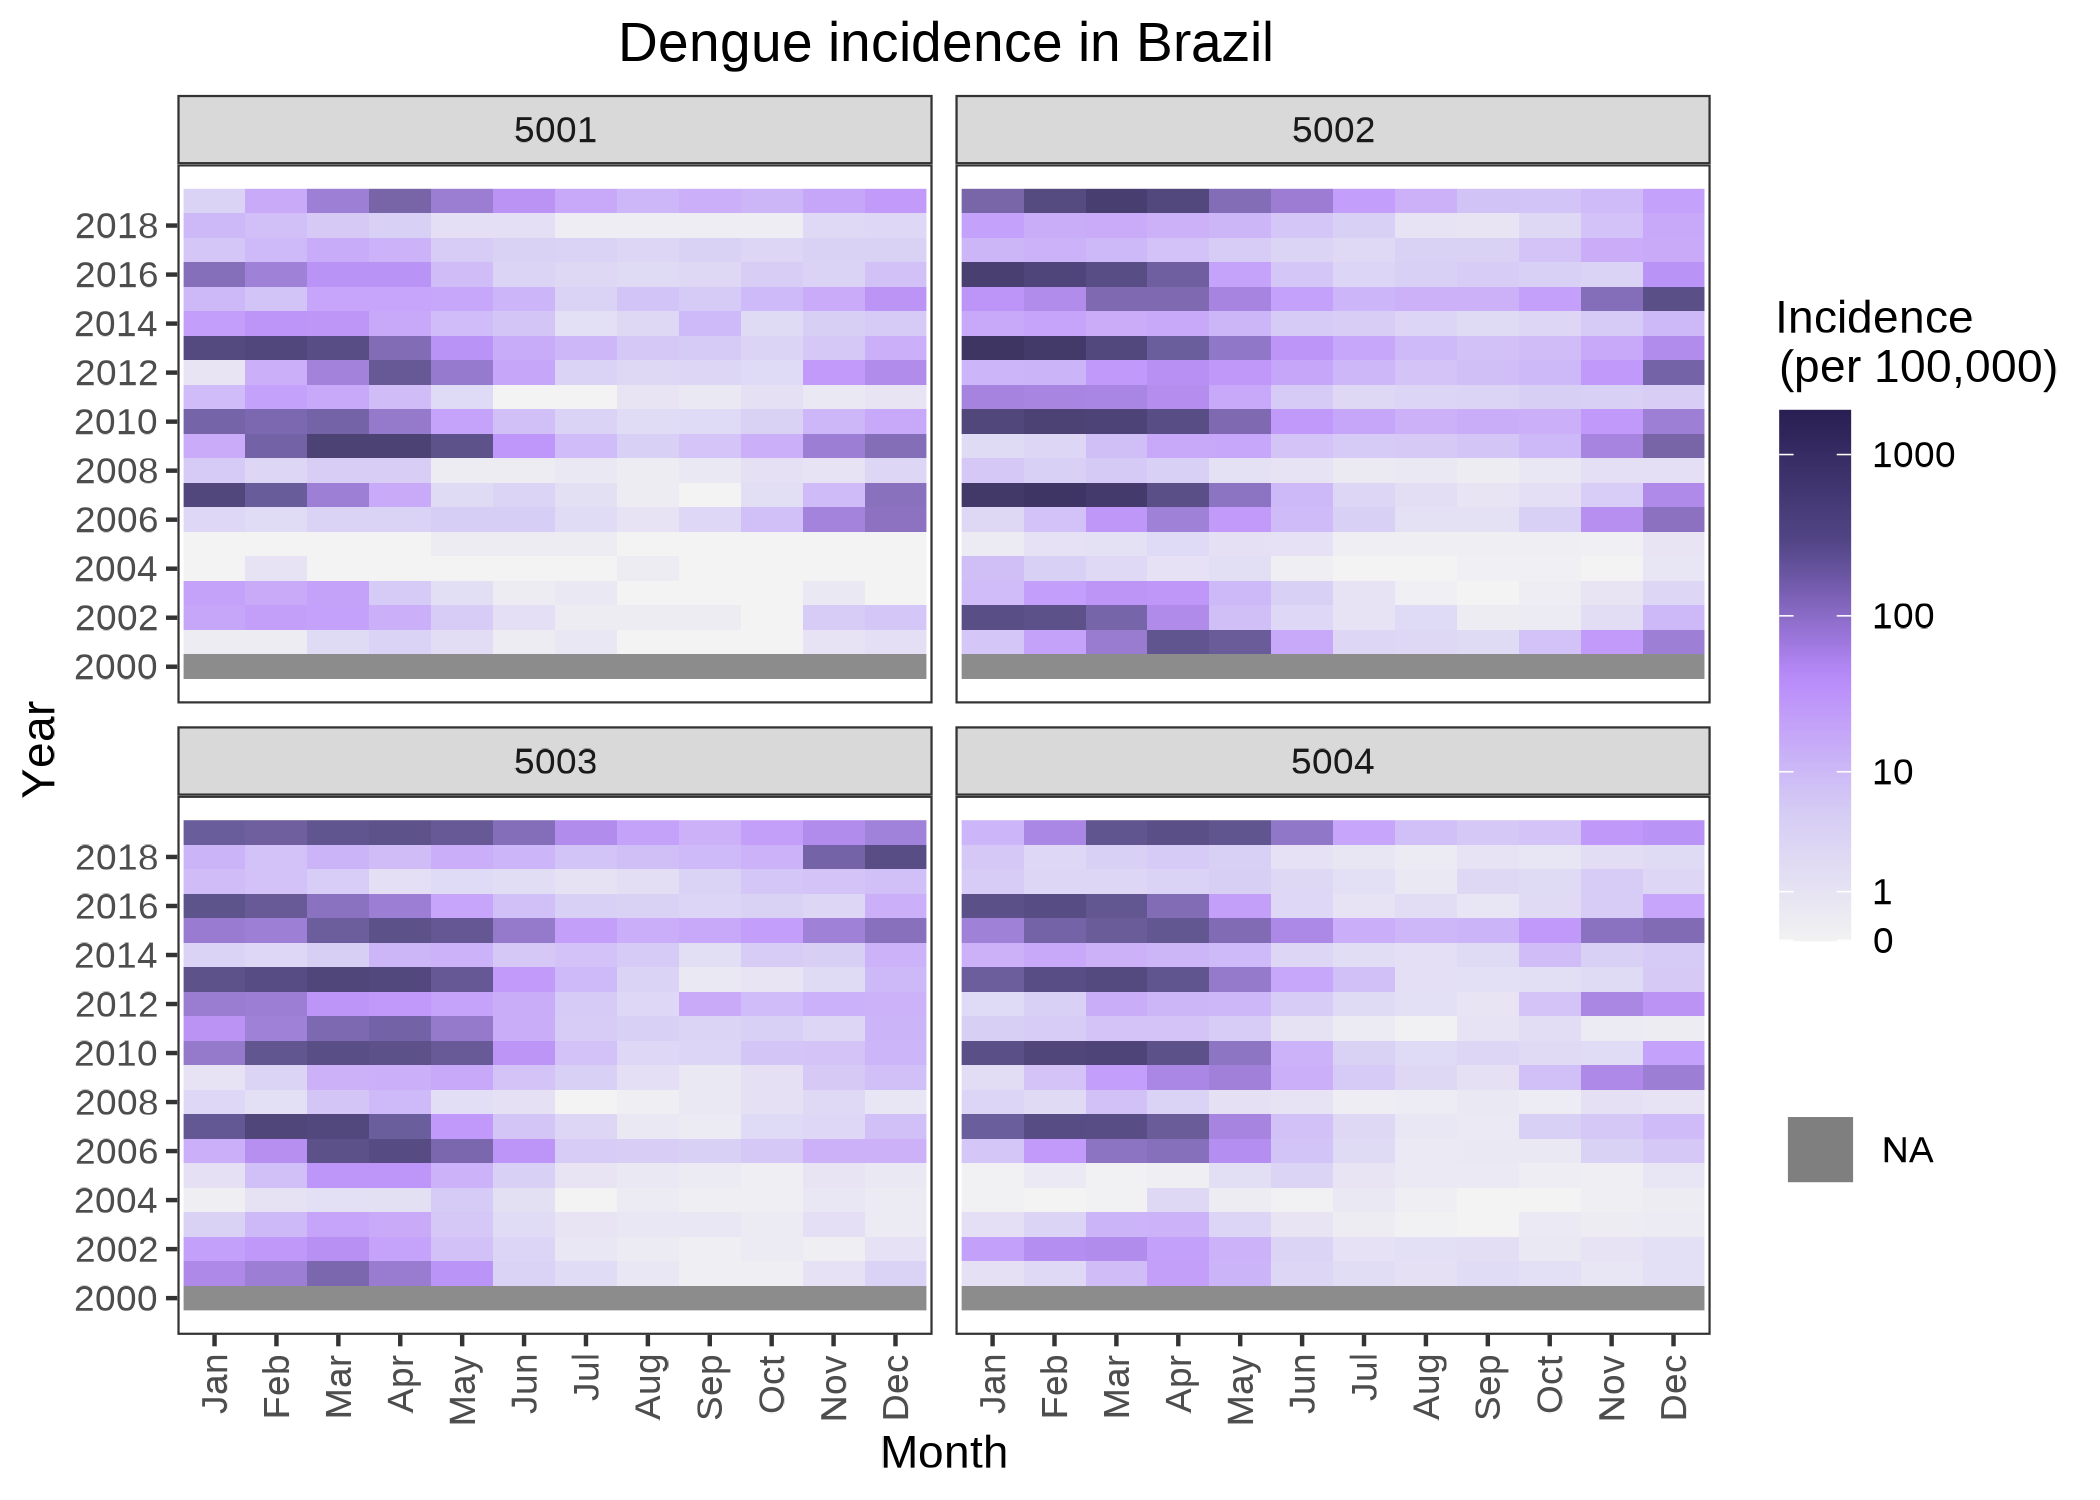
Developers
Giovenale Moirano, PhD 
Barcelona Supercomputing Center
Global Health Resilience
Carles Milà, PhD
Barcelona Supercomputing Center
Global Health Resilience
Anna B. Kawiecki, PhD
Barcelona Supercomputing Center
Global Health Resilience
Rachel Lowe, PhD
Barcelona Supercomputing Center
Global Health Resilience (Group leader)